Grade
5
Same & Different: Genre Graphs
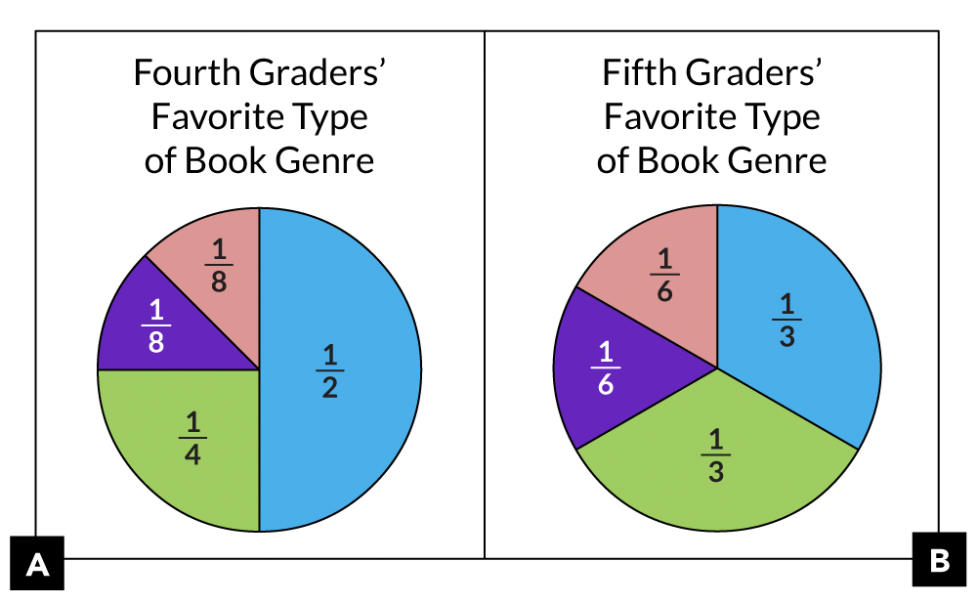
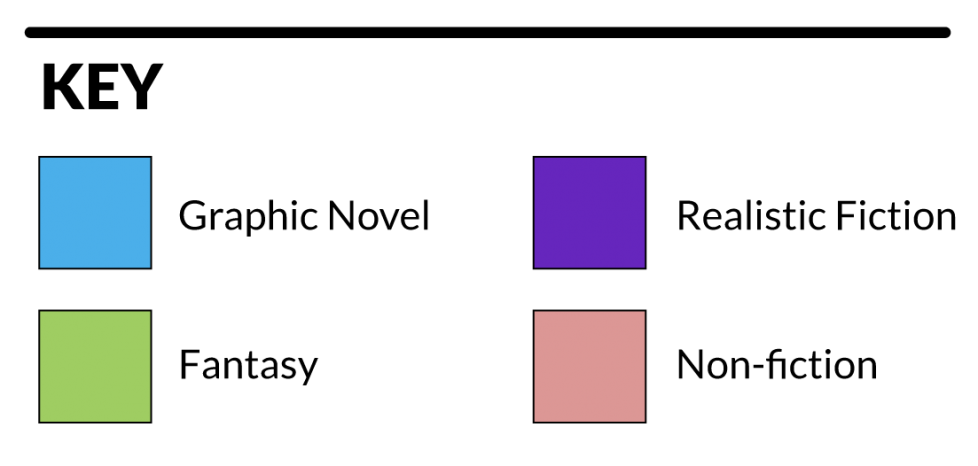
Look at the two pictures below. What do you notice?


- How are pictures A and B mathematically the same, and how are they different?
- A and B are the same because …
- A and B are different because …
- Make a third circle graph labeled with fractional parts. Explain how your picture is the same as pictures A and B, and how it is different.
Printable Version
Google doc for printing and copying
Reference for Educators
Sample problems and solutions